Understanding Complex Data through Better Visualization
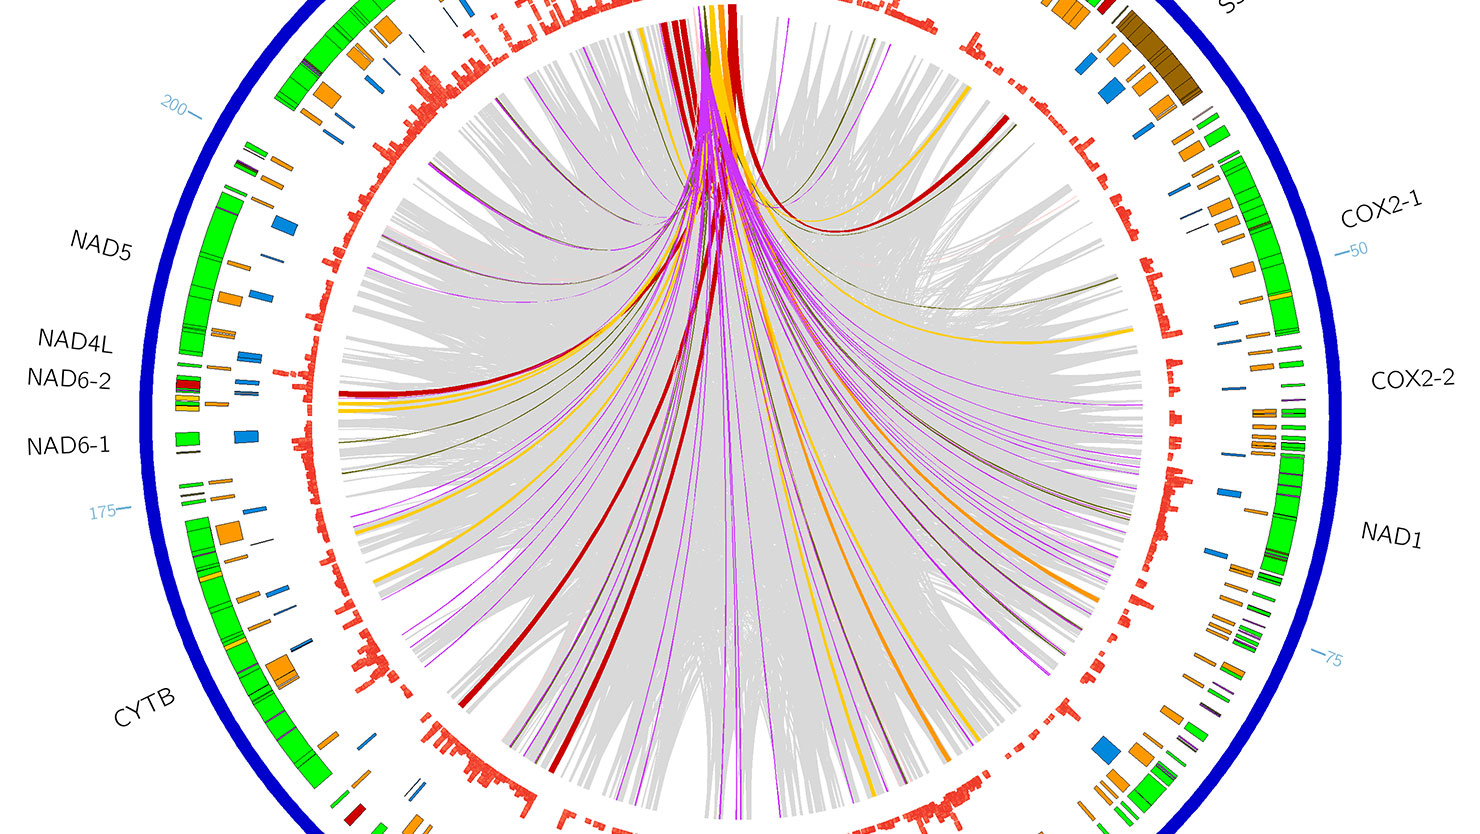
Recently, researchers at JCVI reported on the Rhizoctonia solani mitochondrial genome which was the largest fungal mitochondrion to be sequenced to date. We showed that its unusually large size was probably due to the expansion of multiple genetic elements that populated the genome in somewhat of a ‘parasitic’ relationship. The visualization was meant to impress the number and variety of these repetitive genetic elements, and was selected in a commentary in FEMS Microbiology Letters as an example of how to summarize molecular data in order to obtain an overall view of the results.